One of the earliest questions organisations need to answer when adopting
data mesh is: “Which data products should we build first, and how do we
identify them?” Questions like “What are the boundaries of data product?”,
“How big or small should it be?”, and “Which domain do they belong to?”
often arise. We’ve seen many organisations get stuck in this phase, engaging
in elaborate design exercises that last for months and involve endless
meetings.
We’ve been practicing a methodical approach to quickly answer these
important design questions, offering just enough details for wider
stakeholders to align on goals and understand the expected high-level
outcome, while granting data product teams the autonomy to work
out the implementation details and jump into action.
What are data products?
Before we begin designing data products, let’s first establish a shared
understanding of what they are and what they aren’t.
Data products are the building blocks
of a data mesh, they serve analytical data, and must exhibit the
eight characteristics outlined by Zhamak in her book
Data Mesh: Delivering Data-Driven Value
at Scale.
Discoverable
Data consumers should be able to easily explore available data
products, locate the ones they need, and determine if they fit their
use case.
Addressable
A data product should offer a unique, permanent address
(e.g., URL, URI) that allows it to be accessed programmatically or manually.
Understandable (Self Describable)
Data consumers should be able to
easily grasp the purpose and usage patterns of the data product by
reviewing its documentation, which should include details such as
its purpose, field-level descriptions, access methods, and, if
applicable, a sample dataset.
Trustworthy
A data product should transparently communicate its service level
objectives (SLOs) and adherence to them (SLIs), ensuring consumers
can
trust
it enough to build their use cases with confidence.
Natively Accessible
A data product should cater to its different user personas through
their preferred modes of access. For example, it might provide a canned
report for managers, an easy SQL-based connection for data science
workbenches, and an API for programmatic access by other backend services.
Interoperable (Composable)
A data product should be seamlessly composable with other data products,
enabling easy linking, such as joining, filtering, and aggregation,
regardless of the team or domain that created it. This requires
supporting standard business keys and supporting standard access
patterns.
Valuable on its own
A data product should represent a cohesive information concept
within its domain and provide value independently, without needing
joins with other data products to be useful.
Secure
A data product must implement robust access controls to ensure that
only authorized users or systems have access, whether programmatic or manual.
Encryption should be employed where appropriate, and all relevant
domain-specific regulations must be strictly followed.
Simply put, it’s a
self-contained, deployable, and valuable way to work with data. The
concept applies the proven mindset and methodologies of software product
development to the data space.
Data products package structured, semi-structured or unstructured
analytical data for effective consumption and data driven decision making,
keeping in mind specific user groups and their consumption pattern for
these analytical data
In modern software development, we decompose software systems into
easily composable units, ensuring they are discoverable, maintainable, and
have committed service level objectives (SLOs).
Similarly, a data product
is the smallest valuable unit of analytical data, sourced from data
streams, operational systems, or other external sources and also other
data products, packaged specifically in a way to deliver meaningful
business value. It includes all the necessary machinery to efficiently
achieve its stated goal using automation.
Data products package structured, semi-structured or unstructured
analytical data for effective consumption and data driven decision making,
keeping in mind specific user groups and their consumption pattern for
these analytical data.
What they are not
I believe a good definition not only specifies what something is, but
also clarifies what it isn’t.
Since data products are the foundational building blocks of your
data mesh, a narrower and more specific definition makes them more
valuable to your organization. A well-defined scope simplifies the
creation of reusable blueprints and facilitates the development of
“paved paths” for building and managing data products efficiently.
Conflating data product with too many different concepts not only creates
confusion among teams but also makes it significantly harder to develop
reusable blueprints.
With data products, we apply many
effective software engineering practices to analytical data to address
common ownership and quality issues. These issues, however, aren’t limited
to analytical data—they exist across software engineering. There’s often a
tendency to tackle all ownership and quality problems in the enterprise by
riding on the coattails of data mesh and data products. While the
intentions are good, we’ve found that this approach can undermine broader
data mesh transformation efforts by diluting the language and focus.
One of the most prevalent misunderstandings is conflating data
products with data-driven applications. Data products are natively
designed for programmatic access and composability, whereas
data-driven applications are primarily intended for human interaction
and are not inherently composable.
Here are some common misrepresentations that I’ve observed and the
reasoning behind it :
| Name | Reasons | Missing Characteristic |
|---|---|---|
| Data warehouse | Too large to be an independent composable unit. |
|
| PDF report | Not meant for programmatic access. |
|
| Dashboard | Not meant for programmatic access. While a data product can have a dashboard as one of its outputs or dashboards can be created by consuming one or more data products, a dashboard on its own do not qualify as a data product. |
|
| Table in a warehouse | Without proper metadata or documentation is not a data product. |
|
| Kafka topic | They are typically not meant for analytics. This is reflected in their storage structure — Kafka stores data as a sequence of messages in topics, unlike the column-based storage commonly used in data analytics for efficient filtering and aggregation. They can serve as sources or input ports for data products. |
Working backwards from a use case
Working backwards from the end goal is a core principle of software
development,
and we’ve found it to be highly effective
in modelling data products as well. This approach forces us to focus on
end users and systems, considering how they prefer to consume data
products (through natively accessible output ports). It provides the data
product team with a clear objective to work towards, while also
introducing constraints that prevent over-design and minimise wasted time
and effort.
It may seem like a minor detail, but we can’t stress this enough:
there’s a common tendency to start with the data sources and define data
products. Without the constraints of a tangible use case, you won’t know
when your design is good enough to move forward with implementation, which
often leads to analysis paralysis and lots of wasted effort.
How to do it?
The setup
This process is typically conducted through a series of short workshops. Participants
should include potential users of the data
product, domain experts, and the team responsible for building and
maintaining it. A white-boarding tool and a dedicated facilitator
are essential to ensure a smooth workflow.
The process
Let’s take a common use case we find in fashion retail.
Use case:
As a customer relationship manager, I need timely reports that
provide insights into our most valuable and least valuable customers.
This will help me take action to retain high-value customers and
improve the experience of low-value customers.
To address this use case, let’s define a data product called
“Customer Lifetime Value” (CLV). This product will assign each
registered customer a score that represents their value to the
business, along with recommendations for the next best action that a
customer relationship manager can take based on the predicted
score.
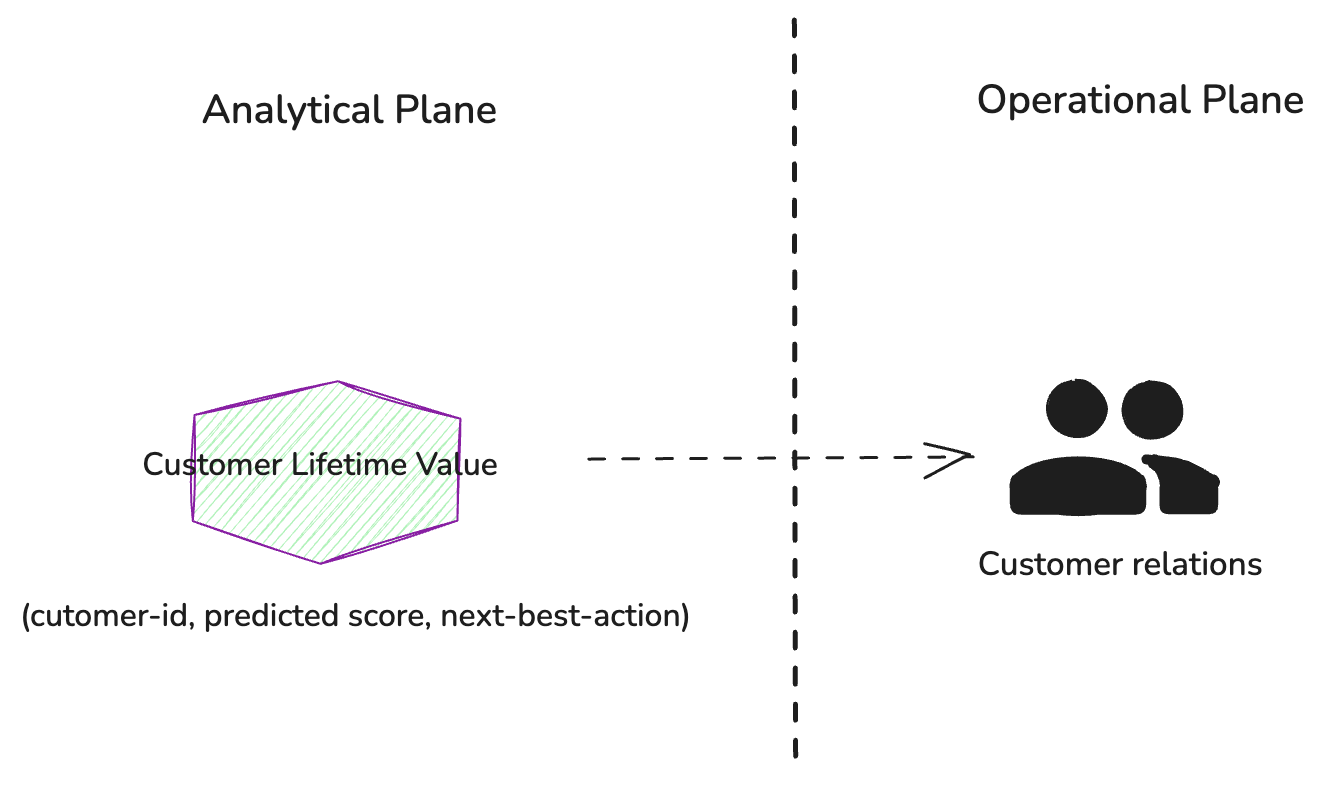
Figure 1: The Customer Relations team
uses the Customer Lifetime Value data product through a weekly
report to guide their engagement strategies with high-value customers.
Working backwards from CLV, we should consider what additional
data products are needed to calculate it. These would include a basic
customer profile (name, age, email, etc.) and their purchase
history.
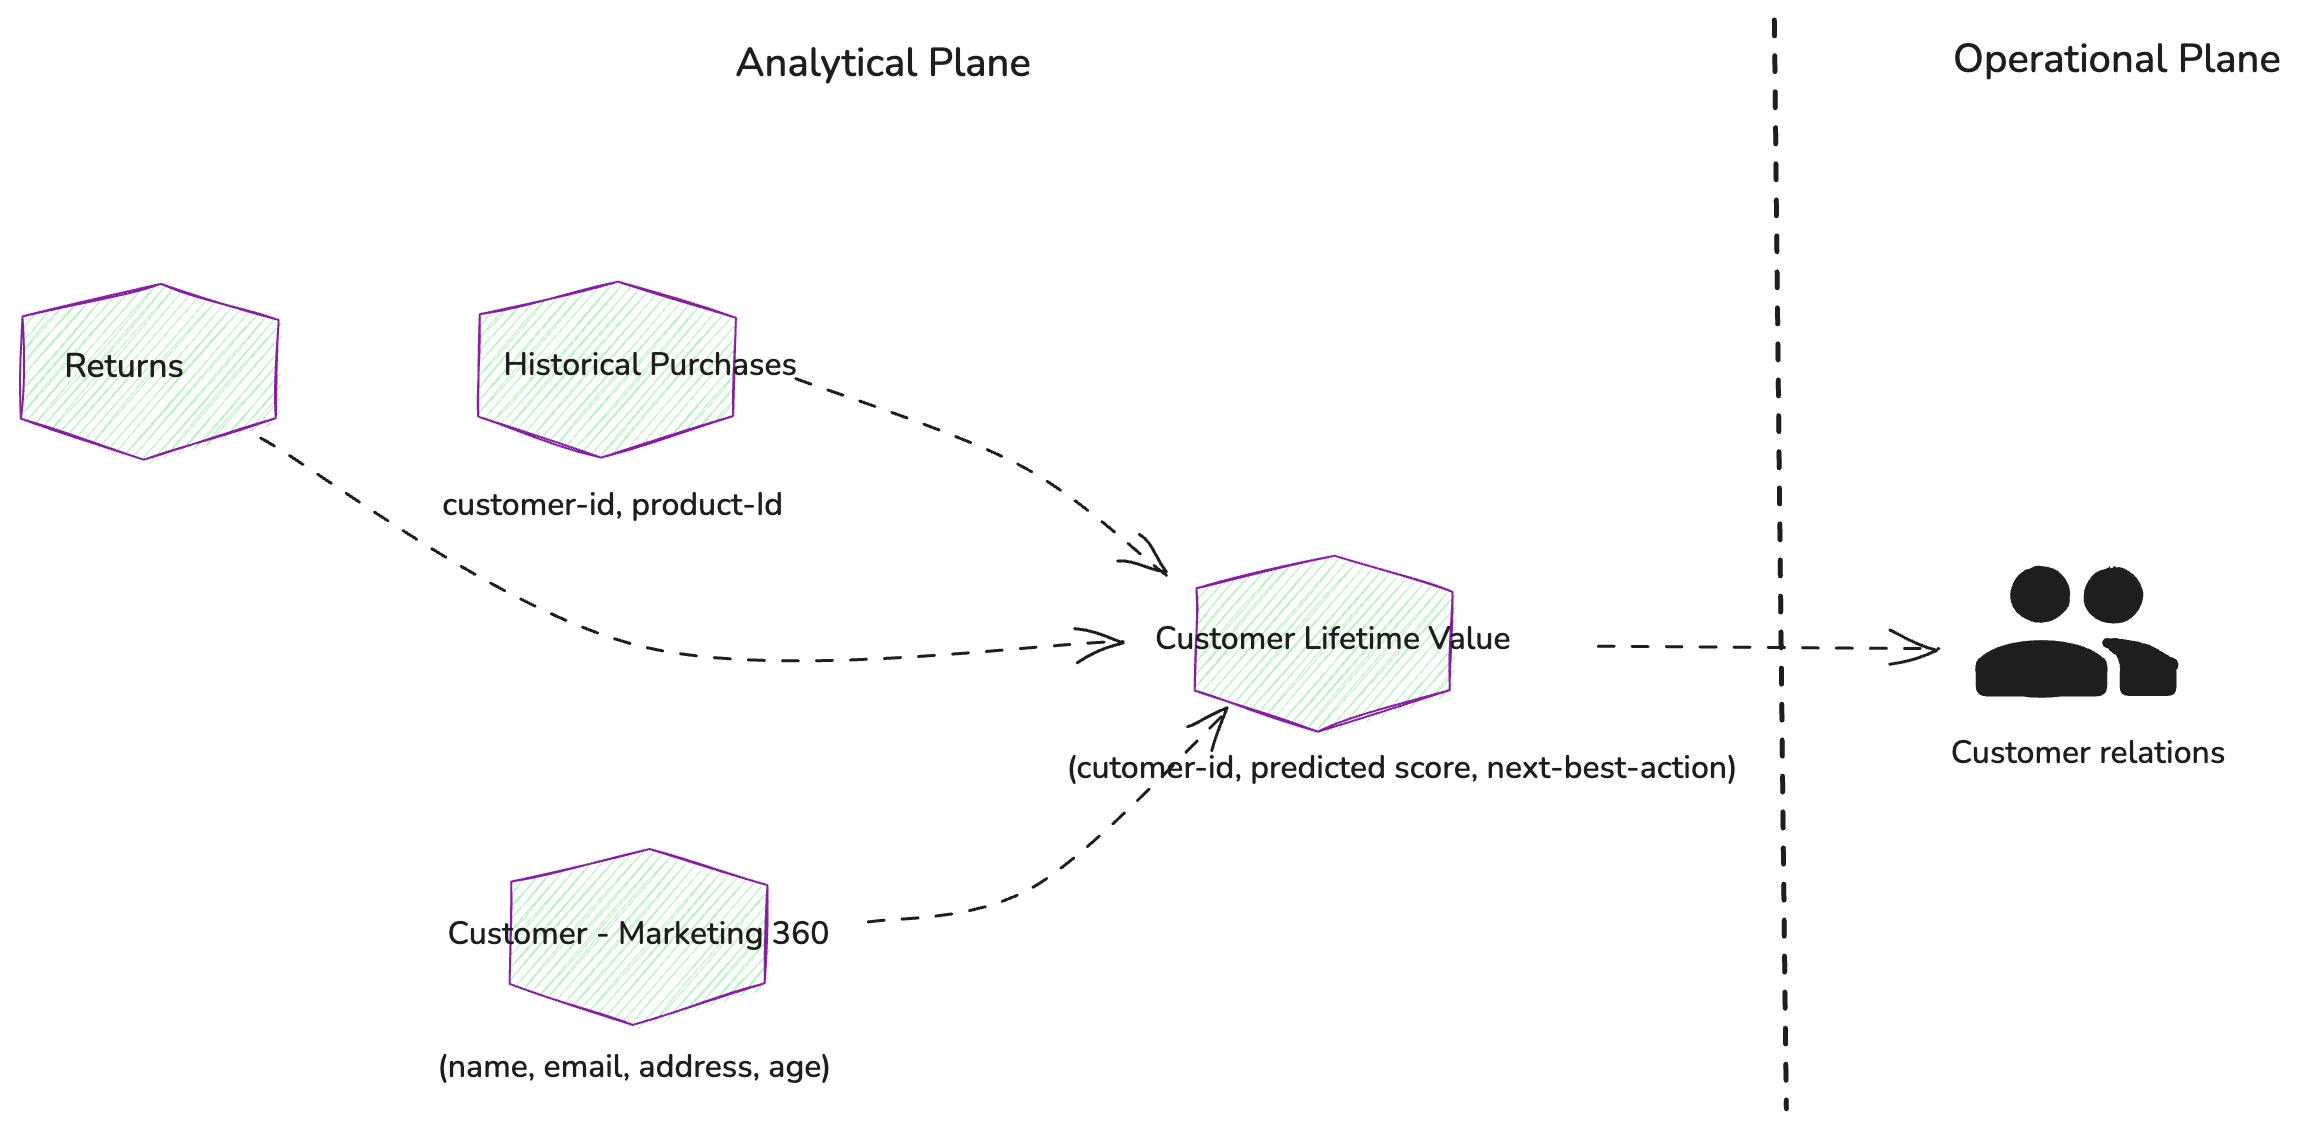
Figure 2: Additional source data
products are required to calculate Customer Lifetime Values
If you find it difficult to describe a data product in one
or two simple sentences, it’s likely not well-defined
The key question we need to ask, where domain expertise is
crucial, is whether each proposed data product represents a cohesive
information concept. Are they valuable on their own? A useful test is
to define a job description for each data product. If you find it
difficult to do so concisely in one or two simple sentences, or if
the description becomes too long, it’s likely not a well-defined data
product.
Let’s apply this test to above data products
Customer Lifetime Value (CLV) :
Delivers a predicted customer lifetime value as a score along
with a suggested next best action for customer representatives.
Customer-marketing 360 :
Offers a comprehensive view of the
customer from a marketing perspective.
Historical Purchases:
Provides a list of historical purchases
(SKUs) for each customer.
Returns :
List of customer-initiated returns.
By working backwards from the “Customer – Marketing 360”,
“Historical Purchases”, and “Returns” data
products, we should identify the system
of records for this data. This will lead us to the relevant
transactional systems that we need to integrate with in order to
ingest the necessary data.
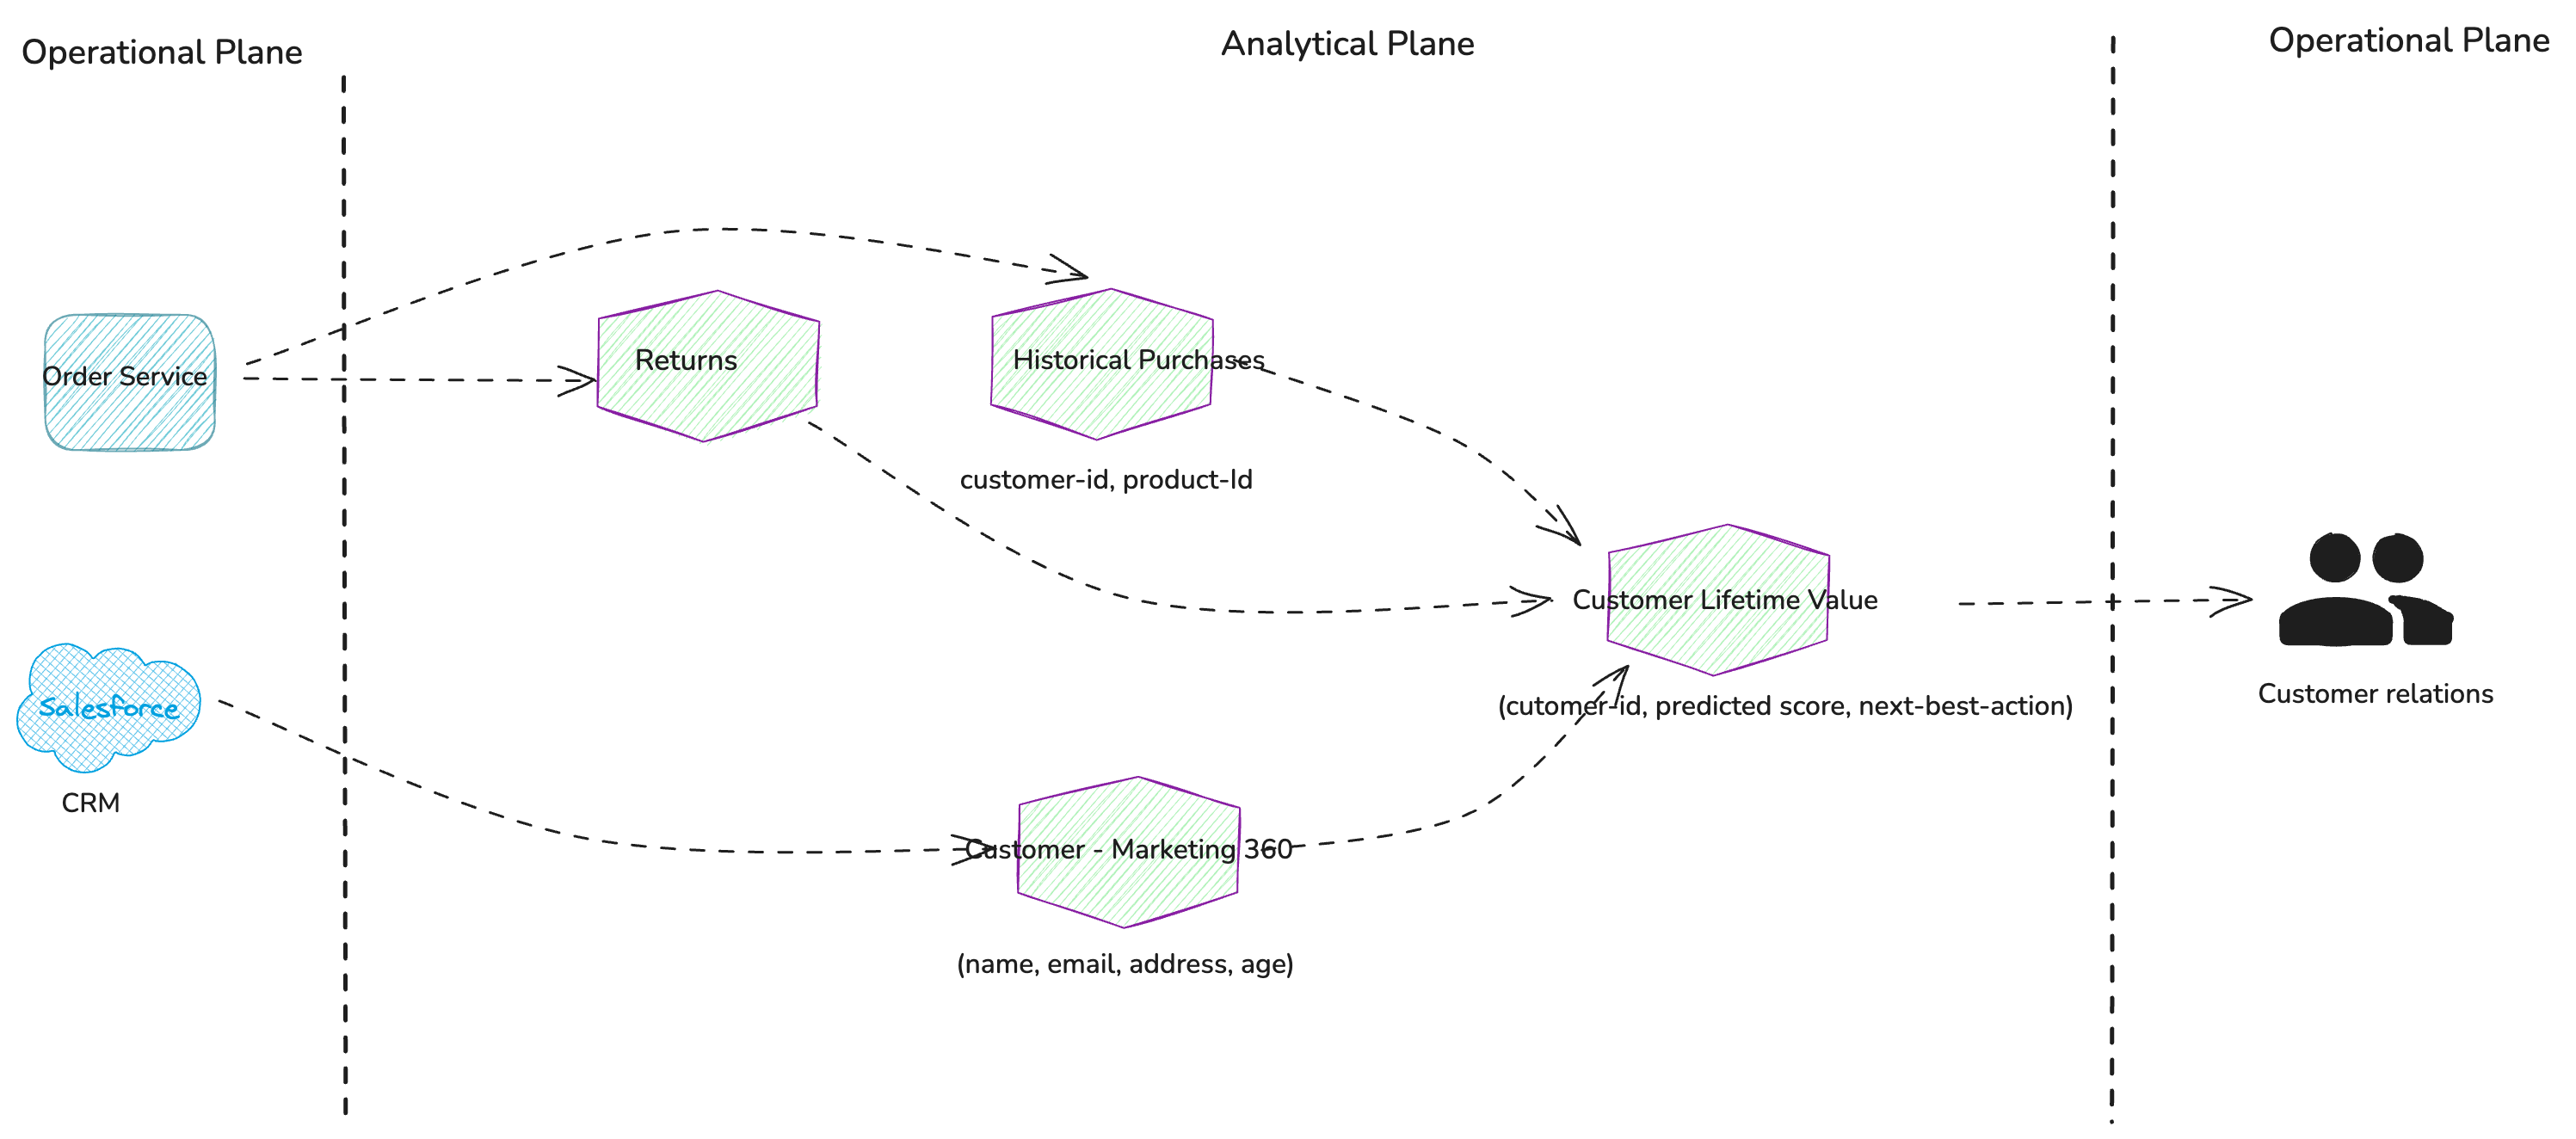
Figure 3: System of records
or transactional systems that expose source data products
Overlay additional use cases and generalise
Now, let’s explore another use case that can be addressed using the
same data products. We’ll apply the same method of working backwards, but
this time we’ll first attempt to generalise the existing data products
to fit the new use case. If that approach isn’t sufficient, we’ll then
consider developing new data products. This way we’ll ensure that we are
not overfitting our data products just one specific use case and they are
mostly reusable.
Use case:
As the marketing backend team, we need to identify high-probability
recommendations for upselling or cross-selling to our customers. This
will enable us to drive increased revenue..
To address this use case, let’s create a data product called
“Product Recommendations” which will generate a list of suggested
products for each customer based on their purchase history.
While we can reuse most of the existing data products, we’ll need to
introduce a new data product called “Products” containing details about
all the items we sell. Additionally, we need to expand the
“Customer-Marketing 360” data product to include gender
information.
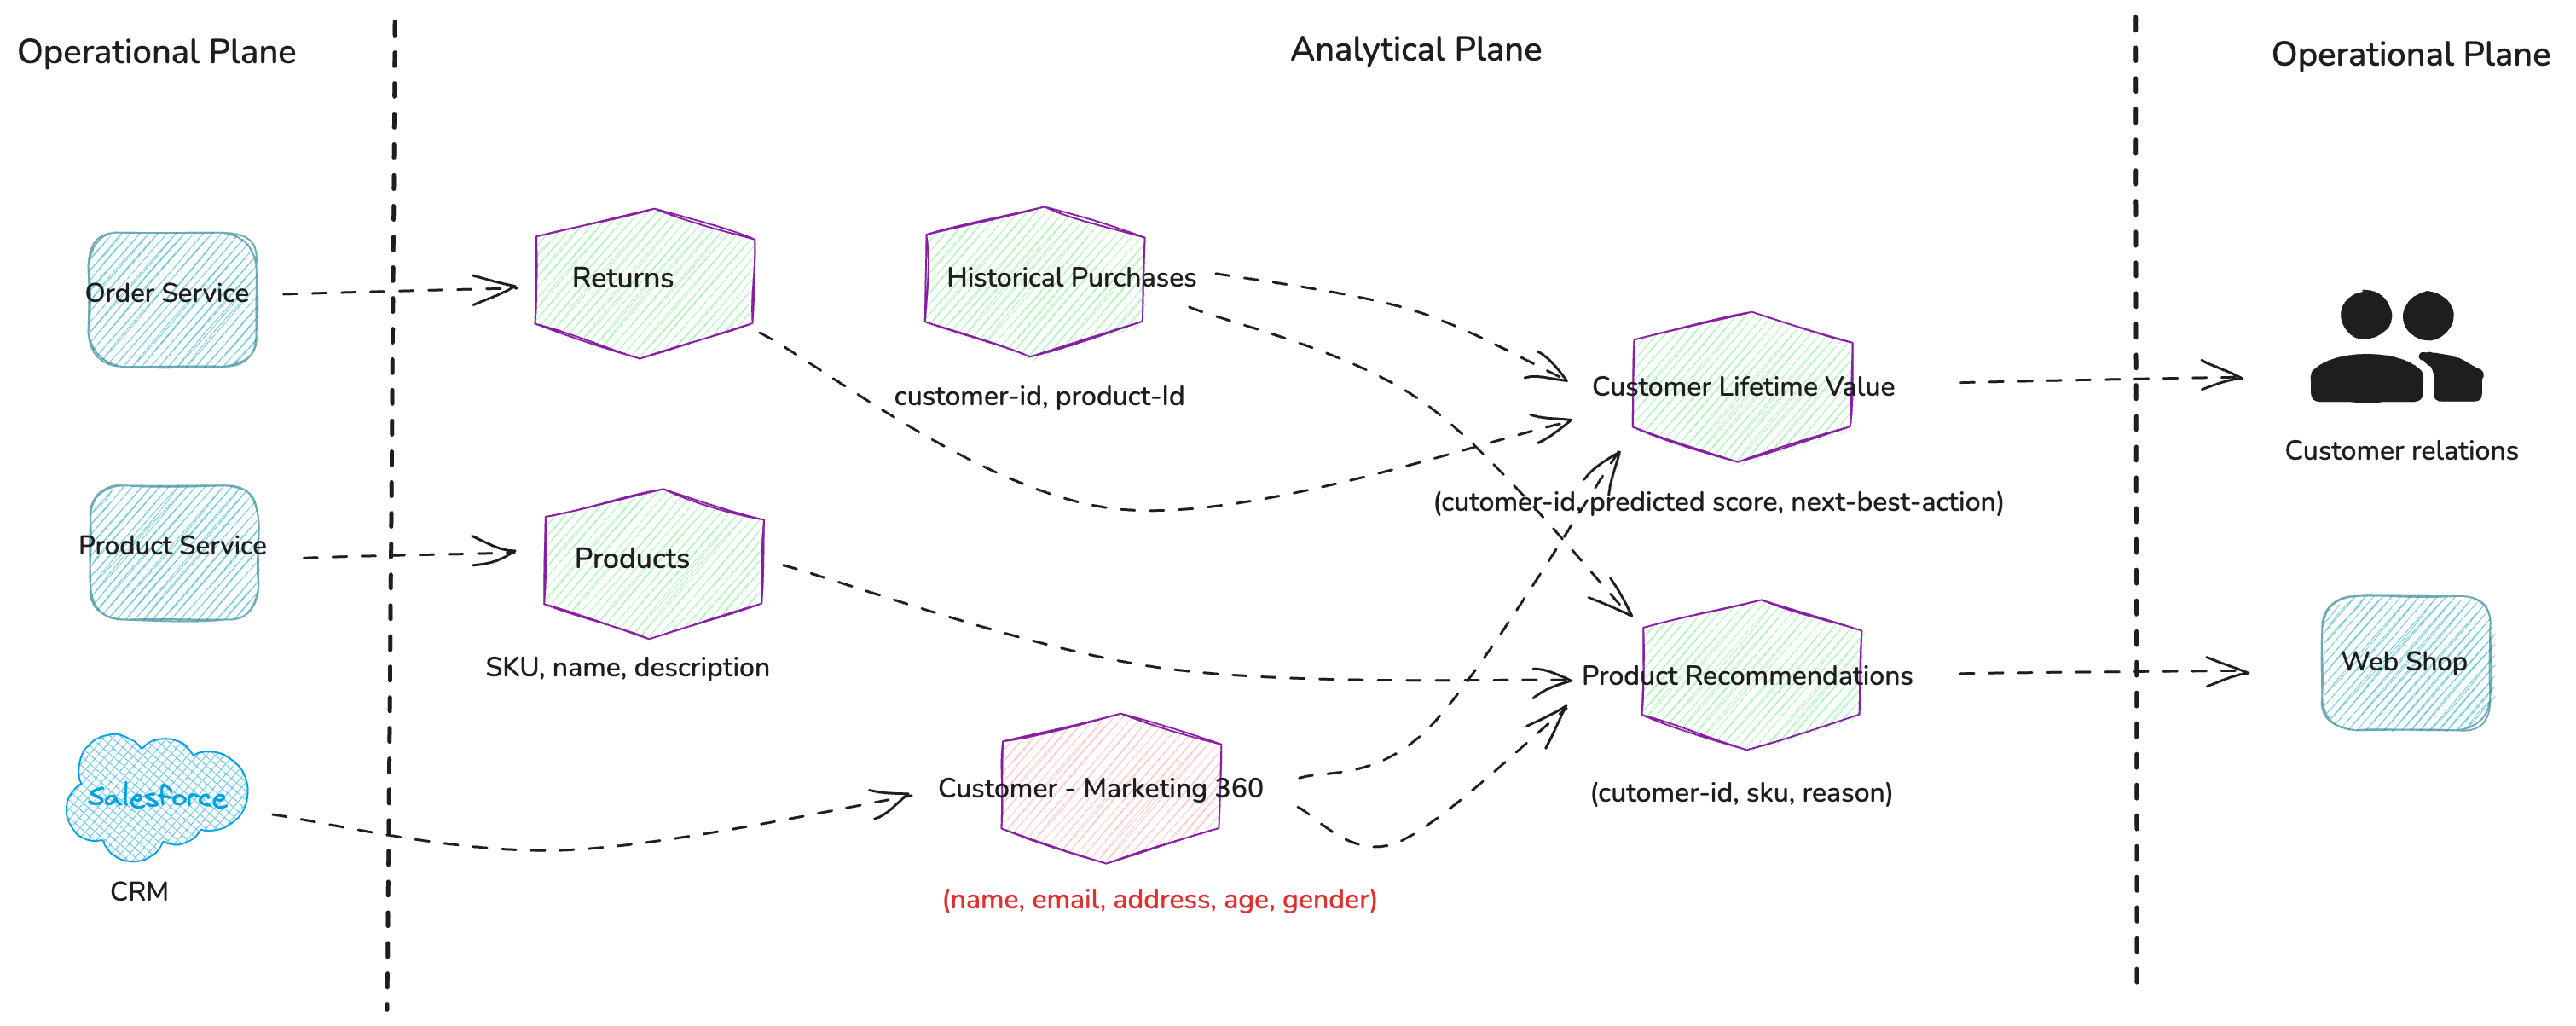
Figure 4: Overlaying Product
Recommendations use case while generalizing existing
data products
So far, we’ve been incrementally building a portfolio (interaction map) of
data products to address two use cases. We recommend continuing this exercise up
to five use cases; beyond that, the marginal value decreases, as most of the
essential data products within a given domain should be mapped out by then.
Assigning domain ownership
After identifying the data products, the next step is to determine the
Bounded Context or
domains they logically belong to.
No
single data product should be owned by multiple domains, as this can
lead to confusion and finger-pointing over quality issues.
This is done by consulting domain experts and discussing each data
product in detail. Key factors include who owns the source systems that
contribute to the data product, which domain has the greatest need for it,
and who is best positioned to build and manage it. In most cases, if the
data product is well defined and cohesive, i.e. “valuable on its own”, the
ownership will be clear. When there are multiple contenders, it’s more
important to assign a single owner and move forward—usually, this should
be the domain with the most pressing need. A key principle is that no
single data product should be owned by multiple domains, as this can
lead to confusion and finger-pointing over quality issues.
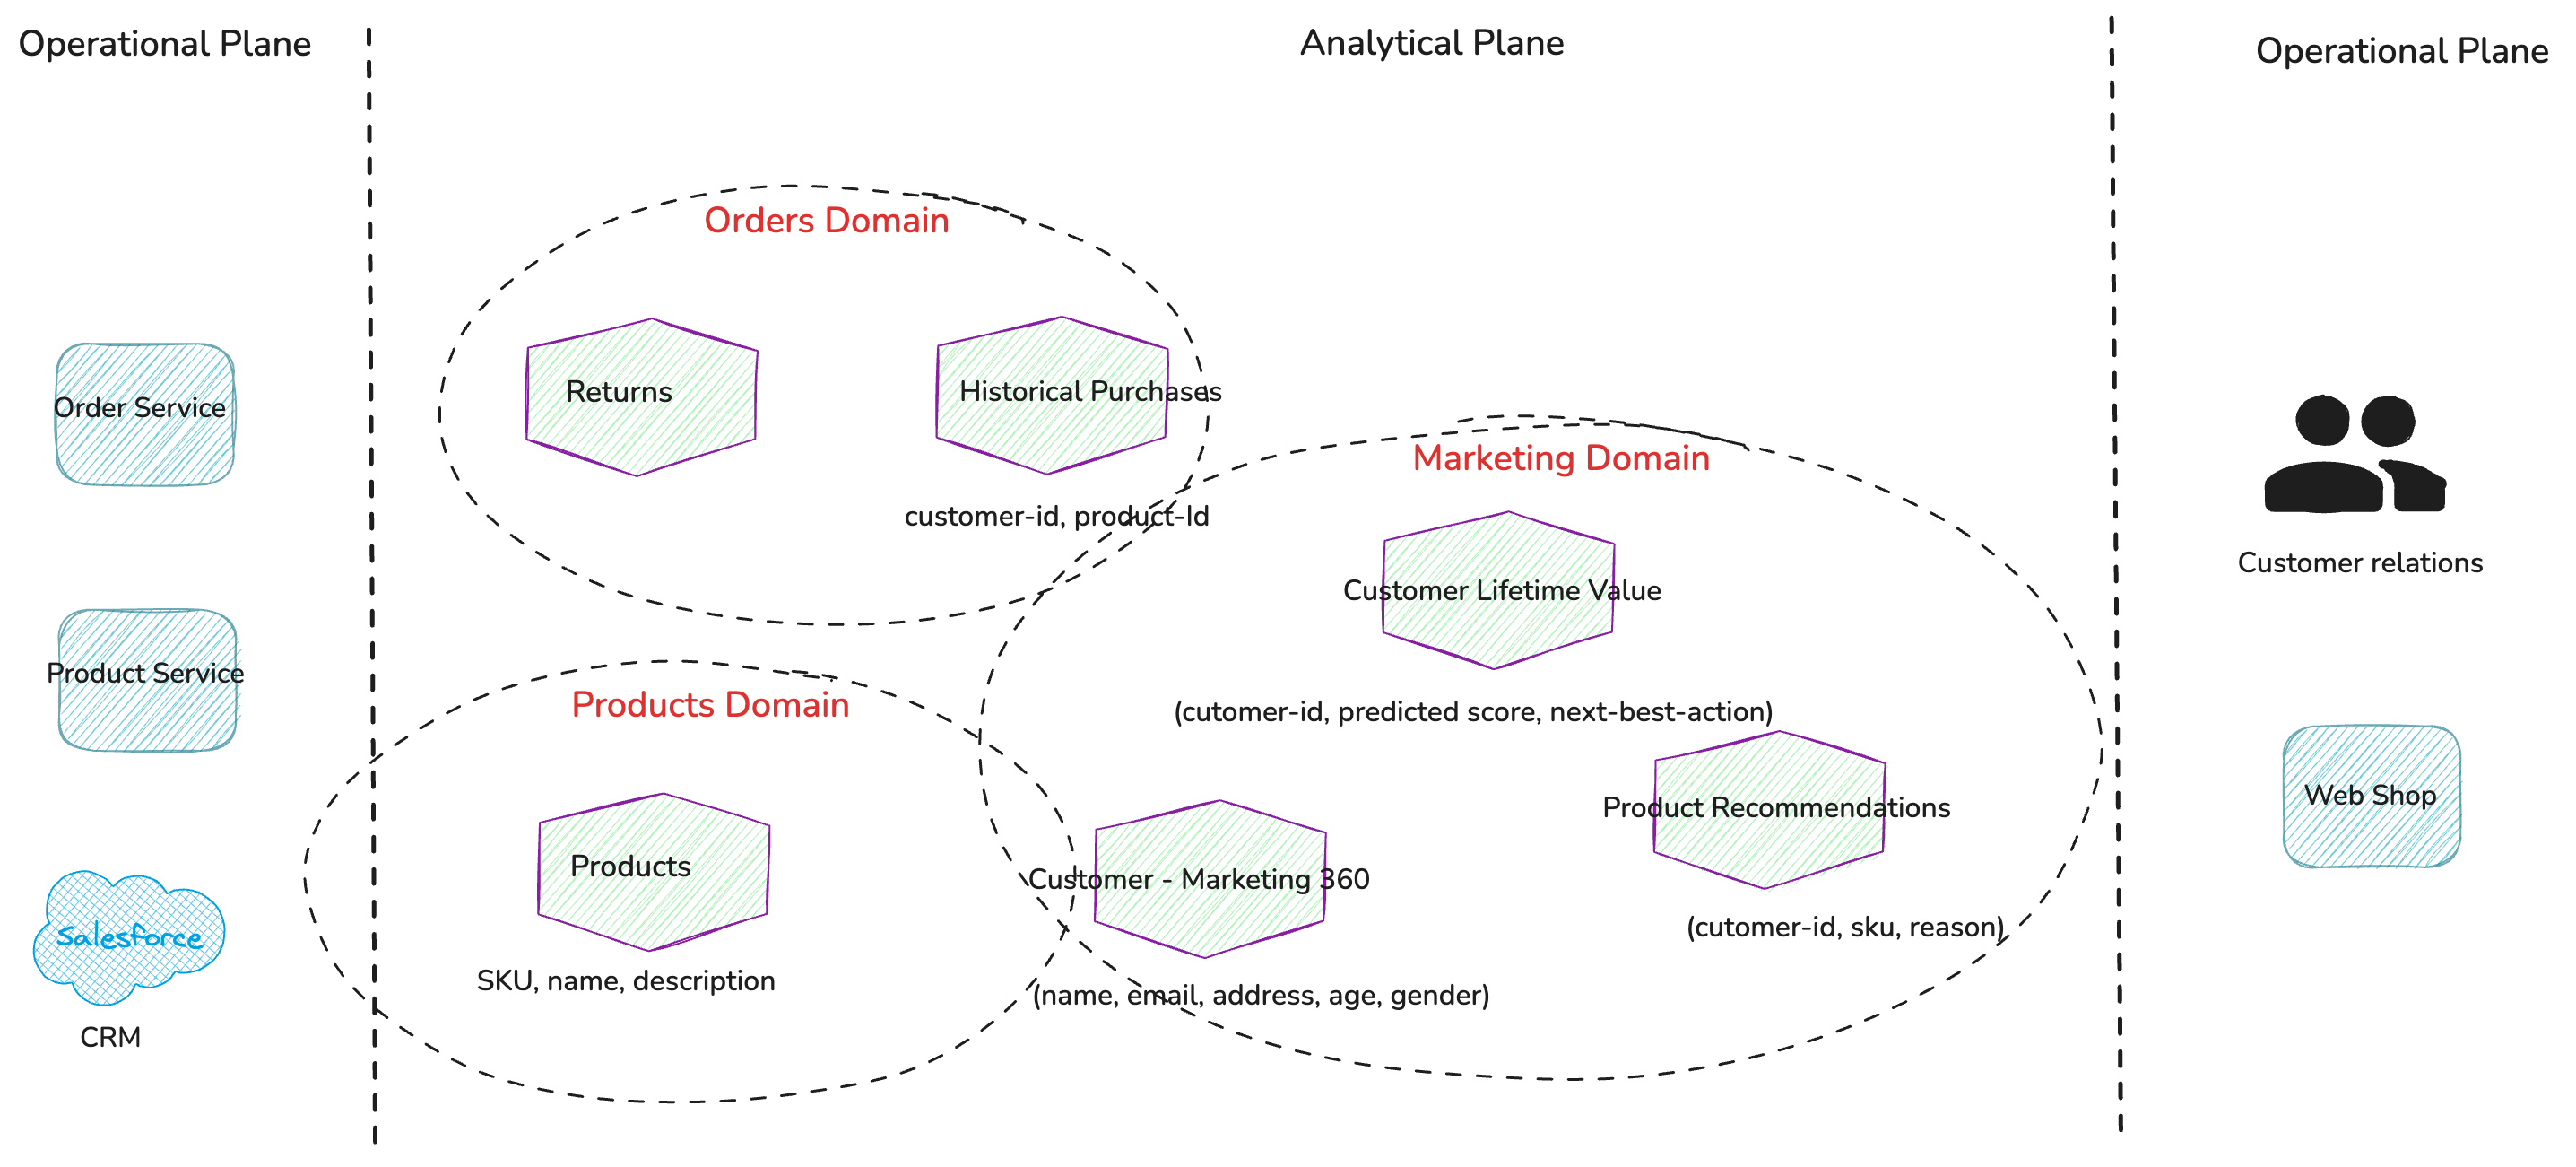
Figure 5: Mapping data products to their
respective domains.
The process of identifying the set of domains in
your organization is beyond the scope of this article. For that, I
recommend referring to Eric Evans’ canonical book on Domain-Driven Design and the Event Storming technique.
While it’s important to consider domain ownership early, it’s
often more efficient to have a single team develop all the necessary data
products to realise the use case at the start of your data mesh journey.
Splitting the work among multiple teams too early can increase
coordination overhead, which is best delayed. Our recommendation is to
begin with a small, cohesive team that handles all data products for the
use case. As you progress, use “team cognitive
load” as a guide for when to split into specific domain teams.
Having a consistent blueprints for all data products will make this
transition of ownership easier when the time comes. The new team can
focus solely on the business logic encapsulated within the data
products, while the organization-wide knowledge of how data products are
built and operated is carried forward.
Defining service level objectives (SLOs)
SLOs will guide the architecture, solution
design and implementation of the data product
The next step is to define service level objectives (SLOs) for the
identified data products. This process involves asking several key
questions, outlined below. It is crucial to perform this exercise,
particularly for consumer-oriented data products, as the desired SLOs for
source-oriented products can often be inferred from these. The defined
SLOs will guide the architecture, solution design and implementation of
the data product, such as whether to implement a batch or real-time
processing pipeline, and will also shape the initial platform capabilities
needed to support it
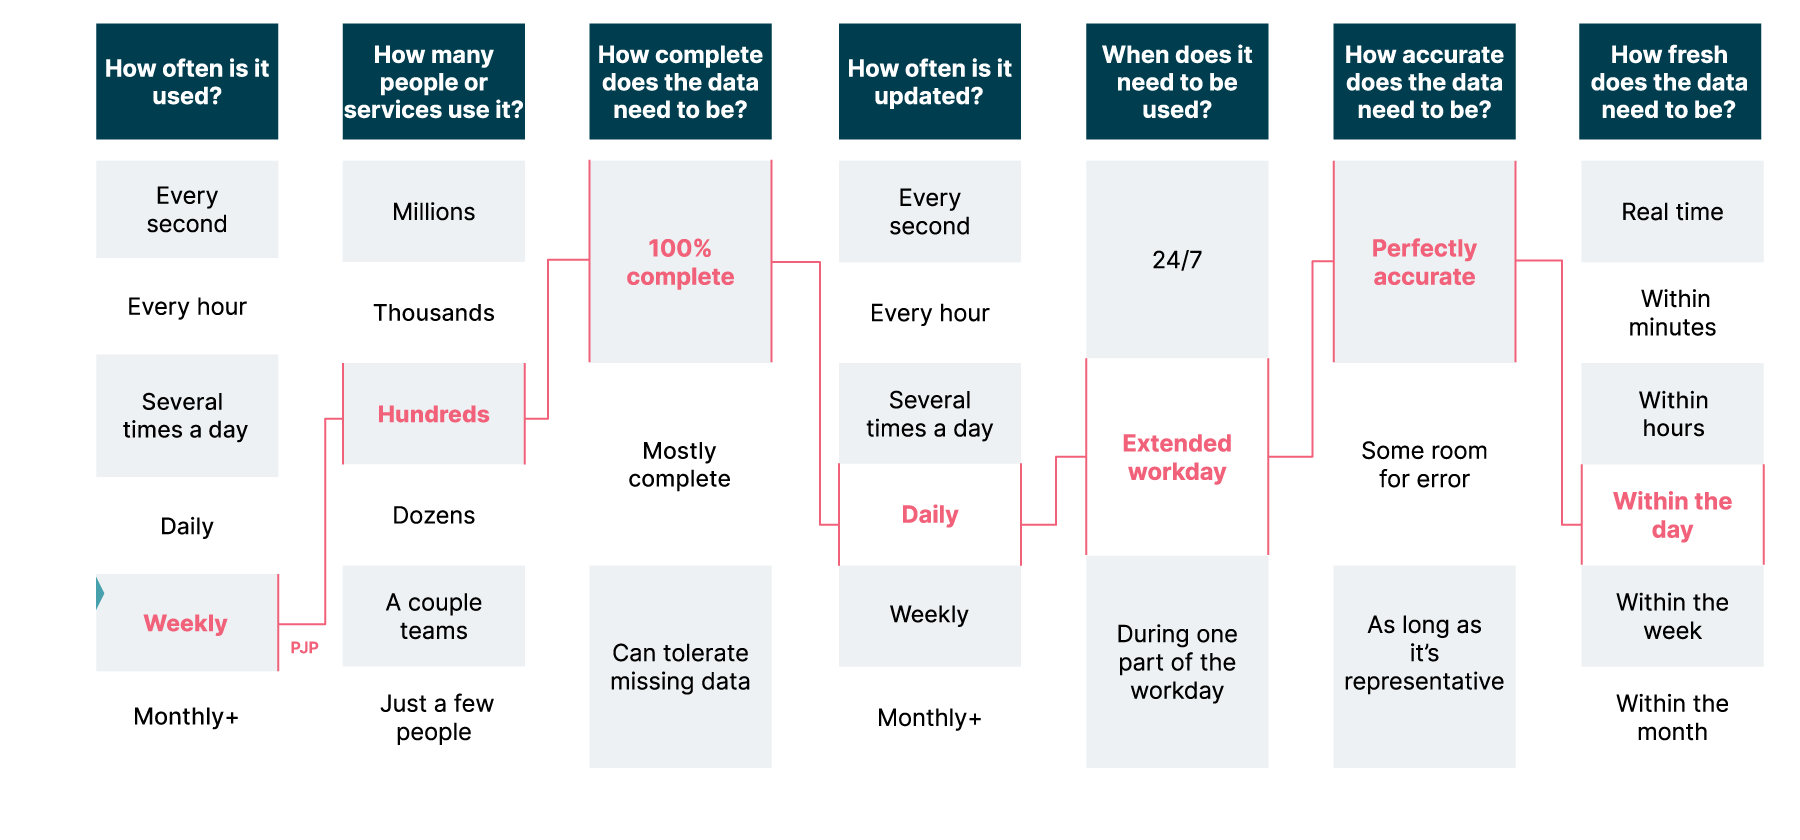
Figure 6: Guiding questions to help define
Service level objectives for data products
During implementation, measurable Service Level Indicators (SLIs) are
derived from the defined SLOs, and platform capabilities are utilized to
automatically measure and publish the results to a central dashboard or a
catalog. This approach enhances transparency for data product consumers
and helps build trust. Here are some excellent resources on how to
achieve this:
A step-by-step guide and
Building An “Amazon.com” For Your Data Products.
