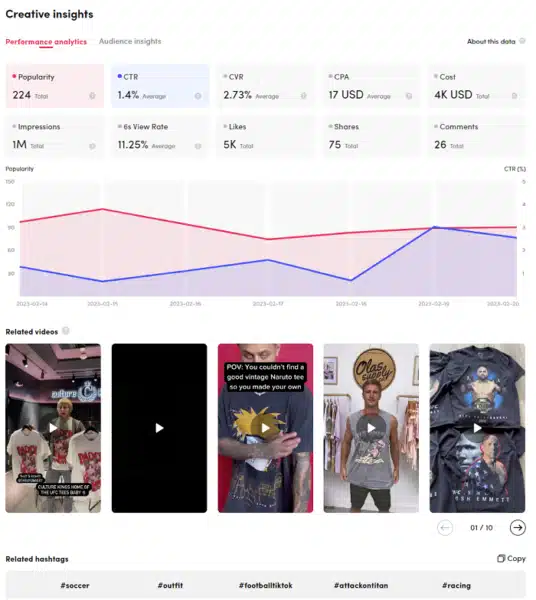
TikTok has just released a “Top Products” element to its Creative Center.
This data provides insights into the popularity of particular products on the app, as indicated by the frequency of ads featuring the item, as well as metrics such as impressions, view-through rate, comments, and likes. Essentially, all the relevant data points are available to analyze the performance of each product.

How it works. Utilizing the filtering options provided allows narrowing down the Top Products listing according to specific regions and product categories. You can also view the data for the last day, 7 days, or 30 days.
To gain a deeper understanding of a particular product, click on the ‘Details’ element on the far right of the listing. This will provide you with a comprehensive product overview, including data such as CTR, CPA, impressions chart, and more.

The ‘Audience insights’ element allows you to see an age bracket breakdown of who’s engaging with these ads, along with related interests, providing key data for analysis and planning efforts.
Dig deeper. You can check out the Creative Center here.
Why we care. This could allow advertisers to make informed decisions about new strategies. By analyzing the performance of specific products based on metrics such as impressions, CTR, CPA, and more, advertisers can determine which products are popular and which are not, and adjust their advertising efforts accordingly.
This data can also help advertisers identify trends in consumer behavior, which can inform their future product development and marketing campaigns. Ultimately, the insights gained from analyzing this data can lead to more effective and efficient advertising strategies, resulting in increased sales and revenue for the advertiser.
