Web debugging tools are so incredibly excellent these days. I remember the days where they didn’t exist and debugging was a total nightmare, even for the simplest of problems. A while back I introduced many of you to Logpoints, a way to output console.log messages without needing to change the source files. Another great breakpoint type is XHR/fetch breakpoints, allowing you to pause execution when an AJAX call is made. Let’s look at XHR/fetch breakpoints!
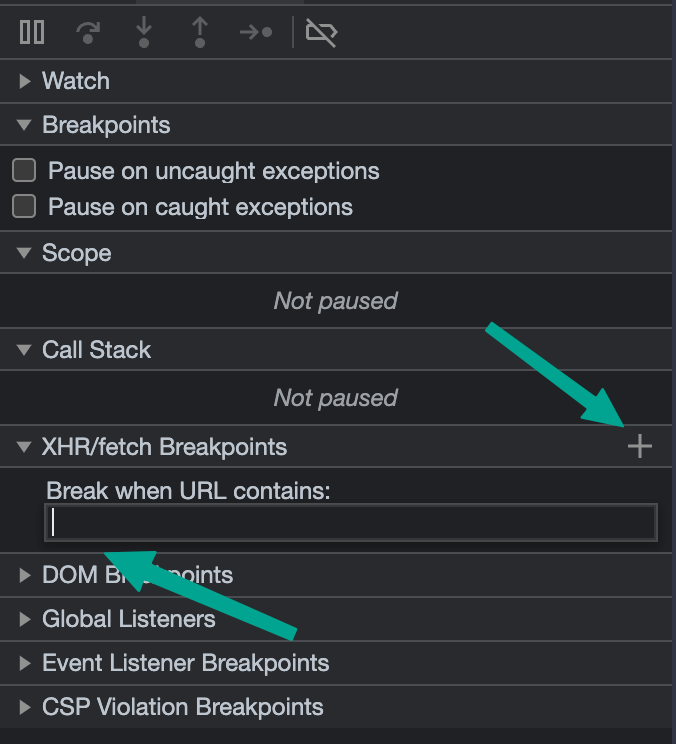
To set an XHR/fetch breakpoint, open your browser’s Developer Tools and click the Sources tab — the same tab you open for other breakpoints. Under the XHR/fetch accordion item, click the big “+” button. You’ll see an empty text input:

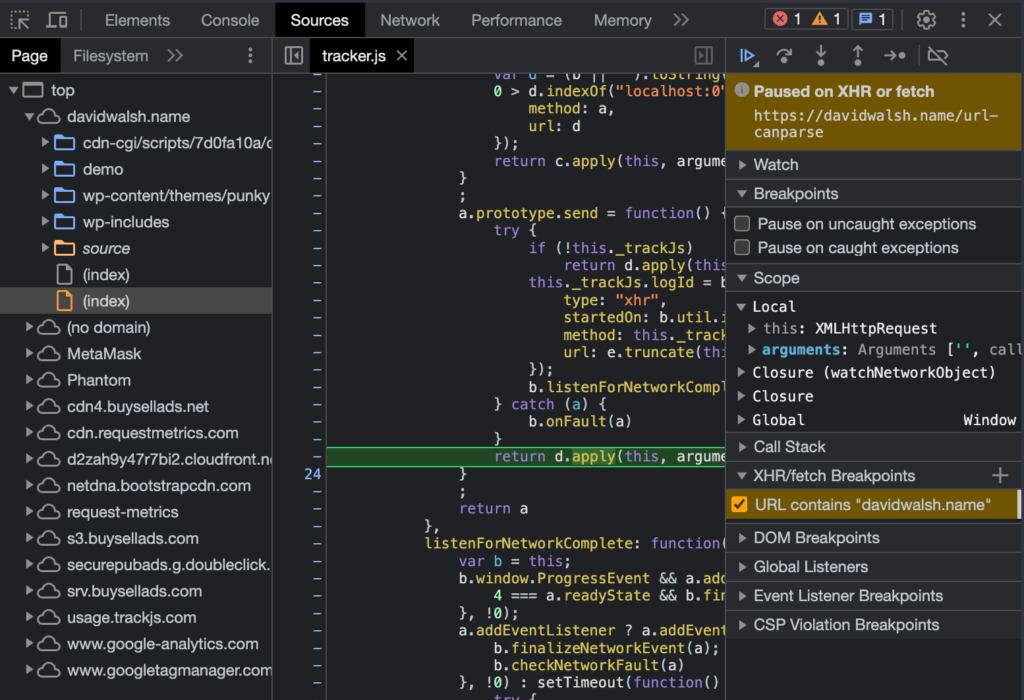
Within that text input, type a string that you’d like to break all XHR/fetch calls on. For example, if I wanted to break any time a fetch request was made, I would input davidwalsh.name:

In the case above, a XHR/fetch request breakpoint halts execution because a request is made to https://davidwalsh.name/url-canparse. You’ll be able to step through and step into like you can with regular breakpoints, and you’ll get a full Call Stack pane to see how execution got to a given point.
XHR/fetch breakpoints are another great way to debug your web app. The more reliant we are on dynamic websites with frequently changing content, debugging fetch calls is a must. Happy debugging!


Chris Coyier’s Favorite CodePen Demos
David asked me if I’d be up for a guest post picking out some of my favorite Pens from CodePen. A daunting task! There are so many! I managed to pick a few though that have blown me away over the past few months. If you…

Create a Simple Slideshow Using MooTools
One excellent way to add dynamism to any website is to implement a slideshow featuring images or sliding content. Of course there are numerous slideshow plugins available but many of them can be overkill if you want to do simple slideshow without controls or events.

Source link
